Overview
This guide explains how to test shared data center proxies using Apache JMeter version 5.6.3. It walks you through configuring HTTP requests to route through proxies and verifying whether the proxies are functional. You can test proxy connectivity, anonymity, and response performance by targeting a demo site like demo-site.example.com.
This guide assumes you have a list of proxies in IP:PORT format, with optional usernames and passwords if proxy authentication is enabled.
Requirements:
- Apache JMeter 5.6.3
- Java 8 or newer
- One or more proxy
IP:PORTcombinations (e.g.,shp-testuser-us-v00001.tp-ns.com:8443) - Proxy username and password (if required)
- A demo website to test (e.g.,
demo-site.example.com)
Step-by-Step Instructions:
Step 1: Launch JMeter
Open JMeter using the executable or terminal.
On Windows: Double-click jmeter.bat in the bin directory.
On Linux/macOS: Run ./jmeter inside the bin directory.
Step 2: Create a New Test Plan
- Right-click on Test Plan
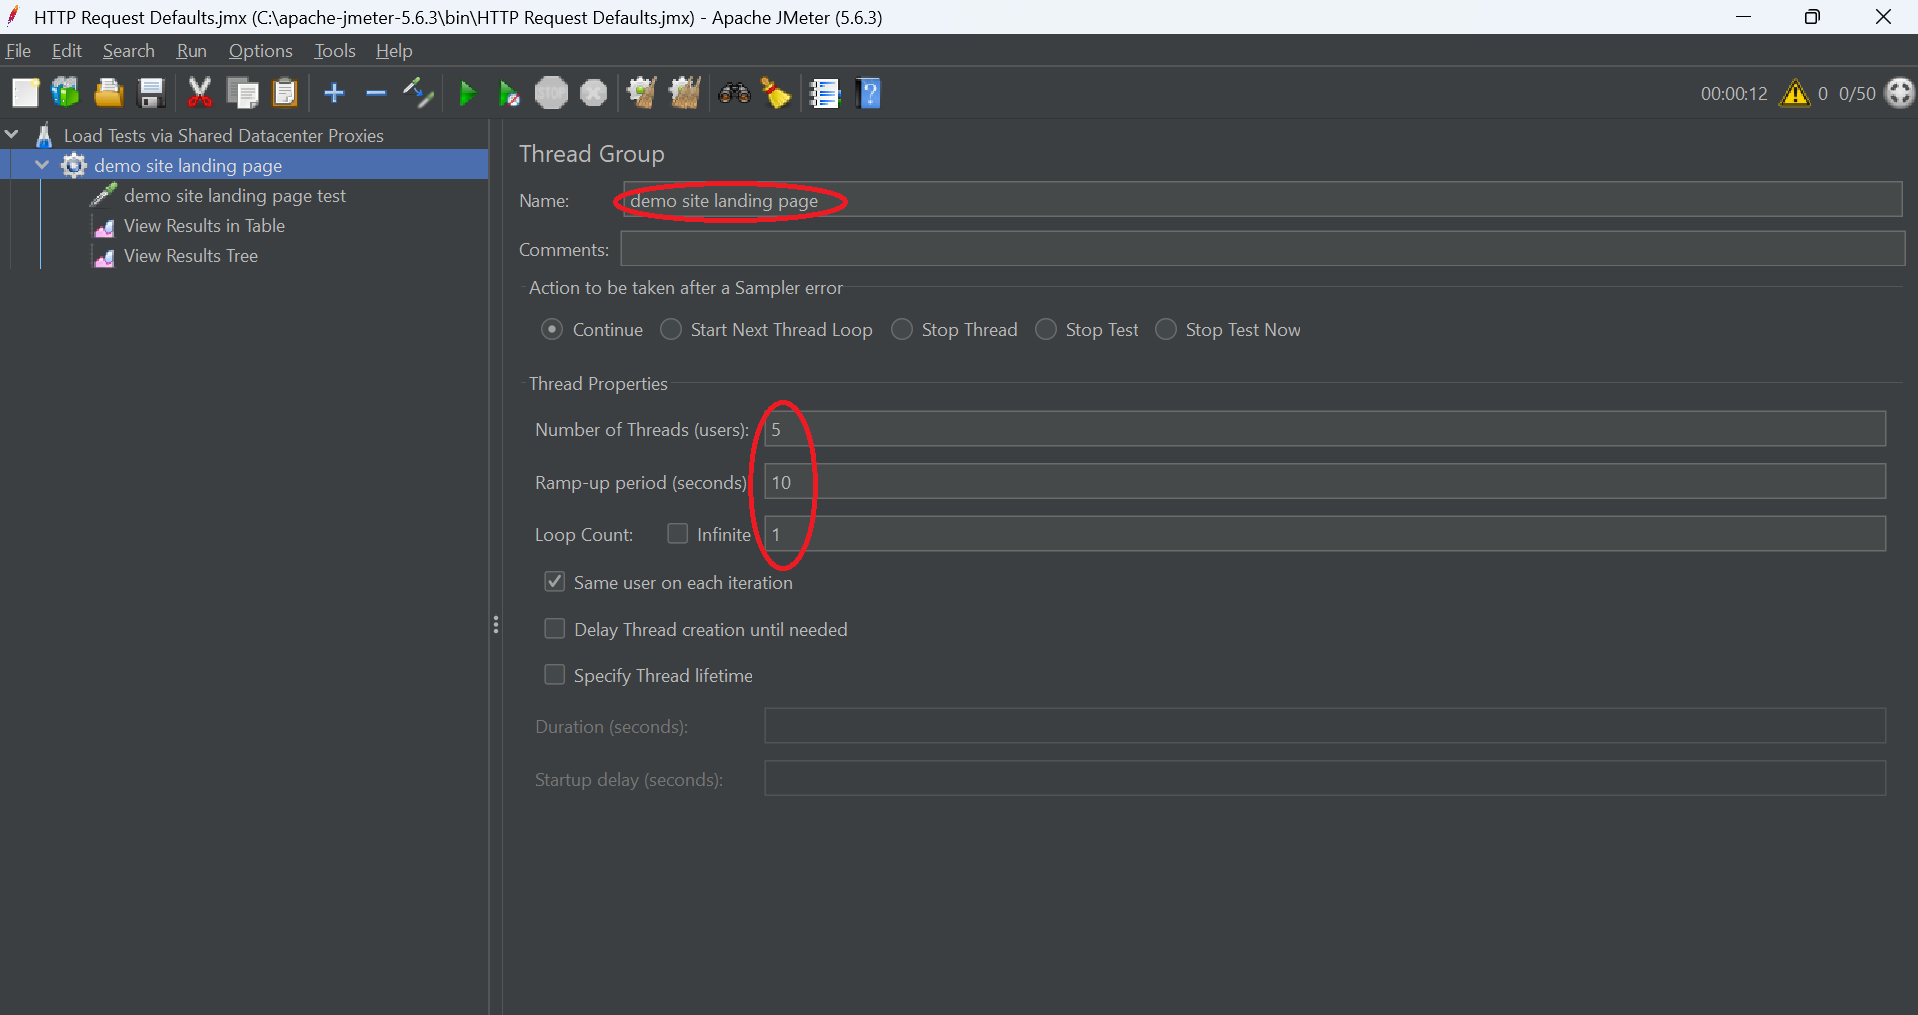
- Choose Add > Threads (Users) > Thread Group
- Set the following values:
- Number of Threads:
5(you can increase this to simulate load) - Ramp-Up Period:
10 - Loop Count:
1(or more to repeat the test)
- Number of Threads:
Step 3: Add an HTTP Request Sampler
- Right-click on Thread Group
- Choose Add > Sampler > HTTP Request
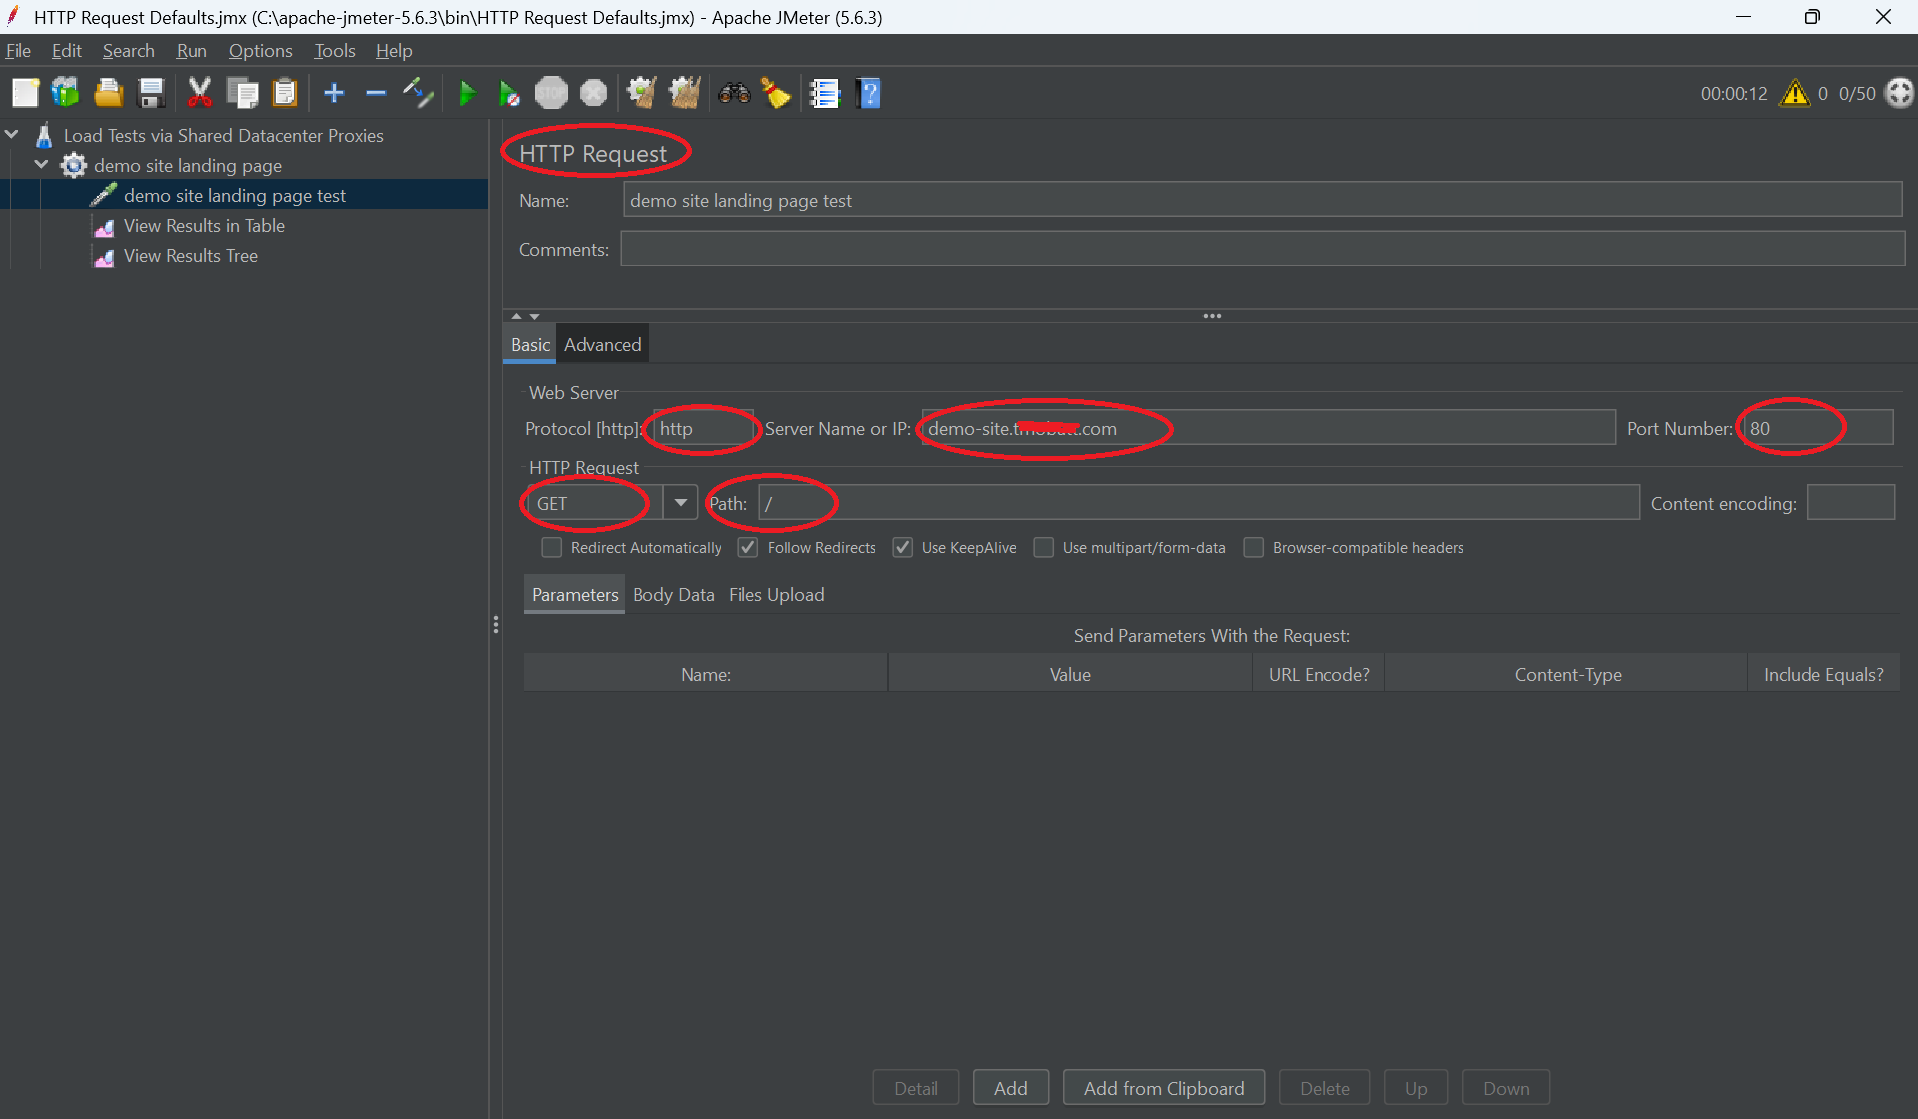
You will now see two configuration tabs inside the HTTP Request element: Basic and Advanced.
In the Basic tab (configure the target site):
- Name: demo site landing page test
- Protocol:
http(orhttpsbased on your web server configured) - Server Name or IP:
demo-site.example.com - Path:
/(or any endpoint on your demo site) - Method:
GET
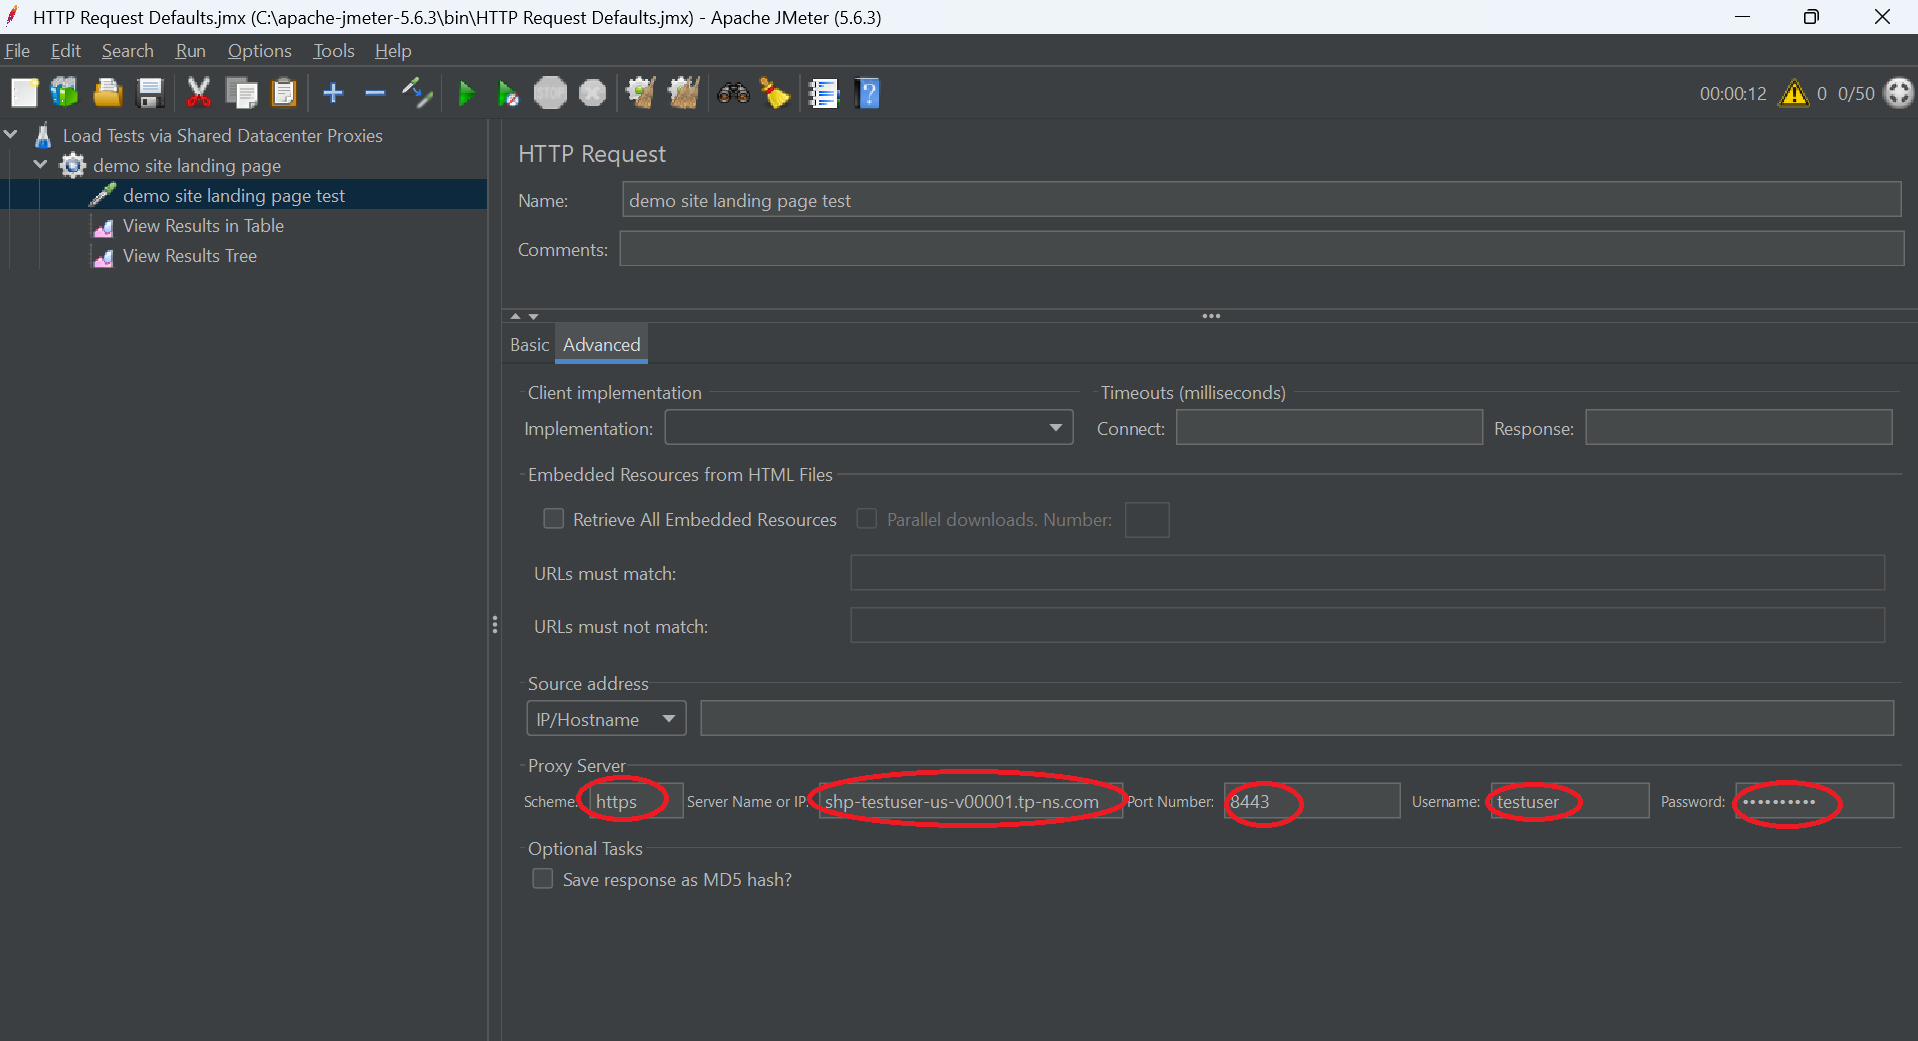
Step 4: Configure Proxy Settings (Advanced tab)
- Click the "Advanced" tab in the same HTTP Request sampler.
- Scroll down to the "Proxy Server" section.
Set the following:
- Server:
shp-testuser-us-v00001.tp-ns.com - Port:
proxy port (e.g., 8443) - Username:
testuser(leave blank if not required) - Password:
your proxy password(leave blank if not required)
This will route the HTTP request through your proxy server.
Step 5: Add a Listener to View Results
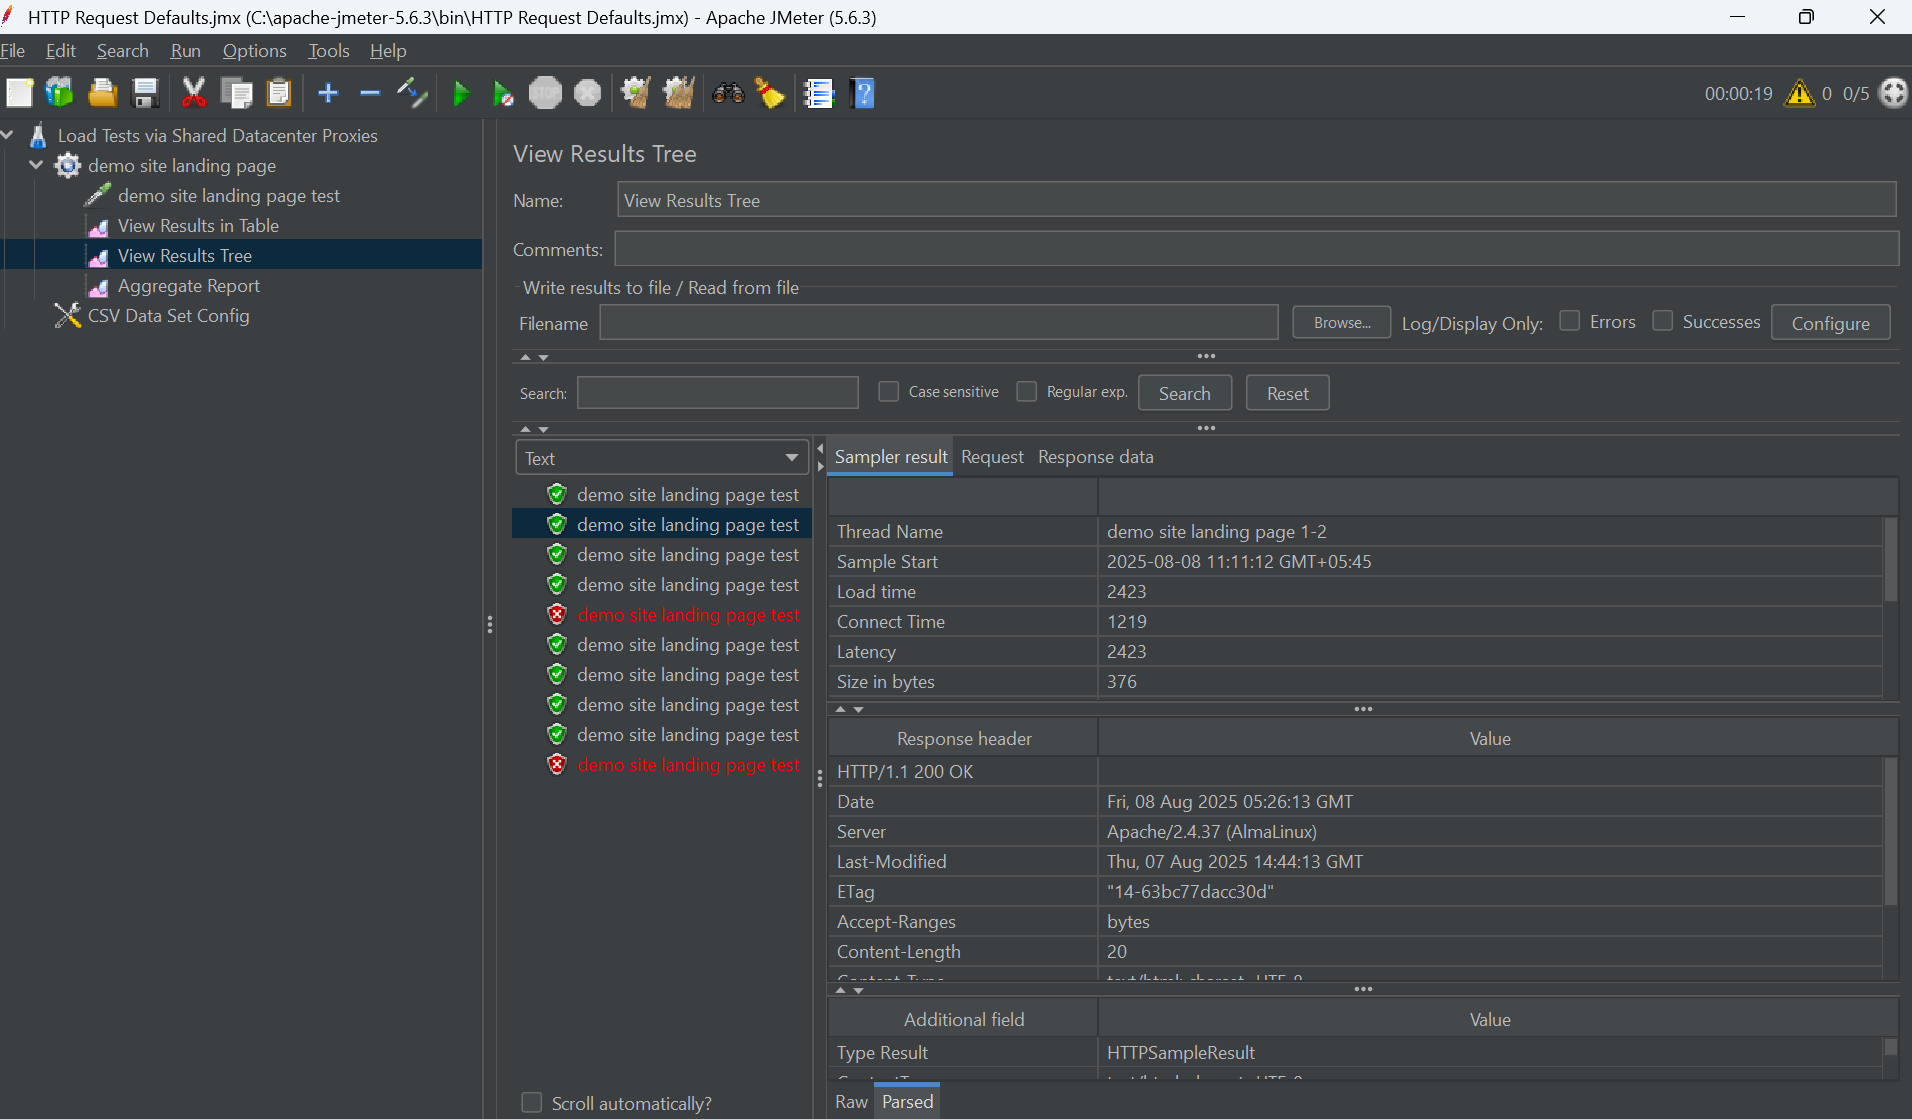
Right-click on Thread Group
Choose Add > Listener > View Results Tree: This shows each individual request in a tree format. You can click on a request to see the full details, including request headers, the target URL, the proxy used, and the complete server response. This is useful for confirming that the request went through the proxy and that the response contains the expected data, such as the proxy IP instead of your local IP.
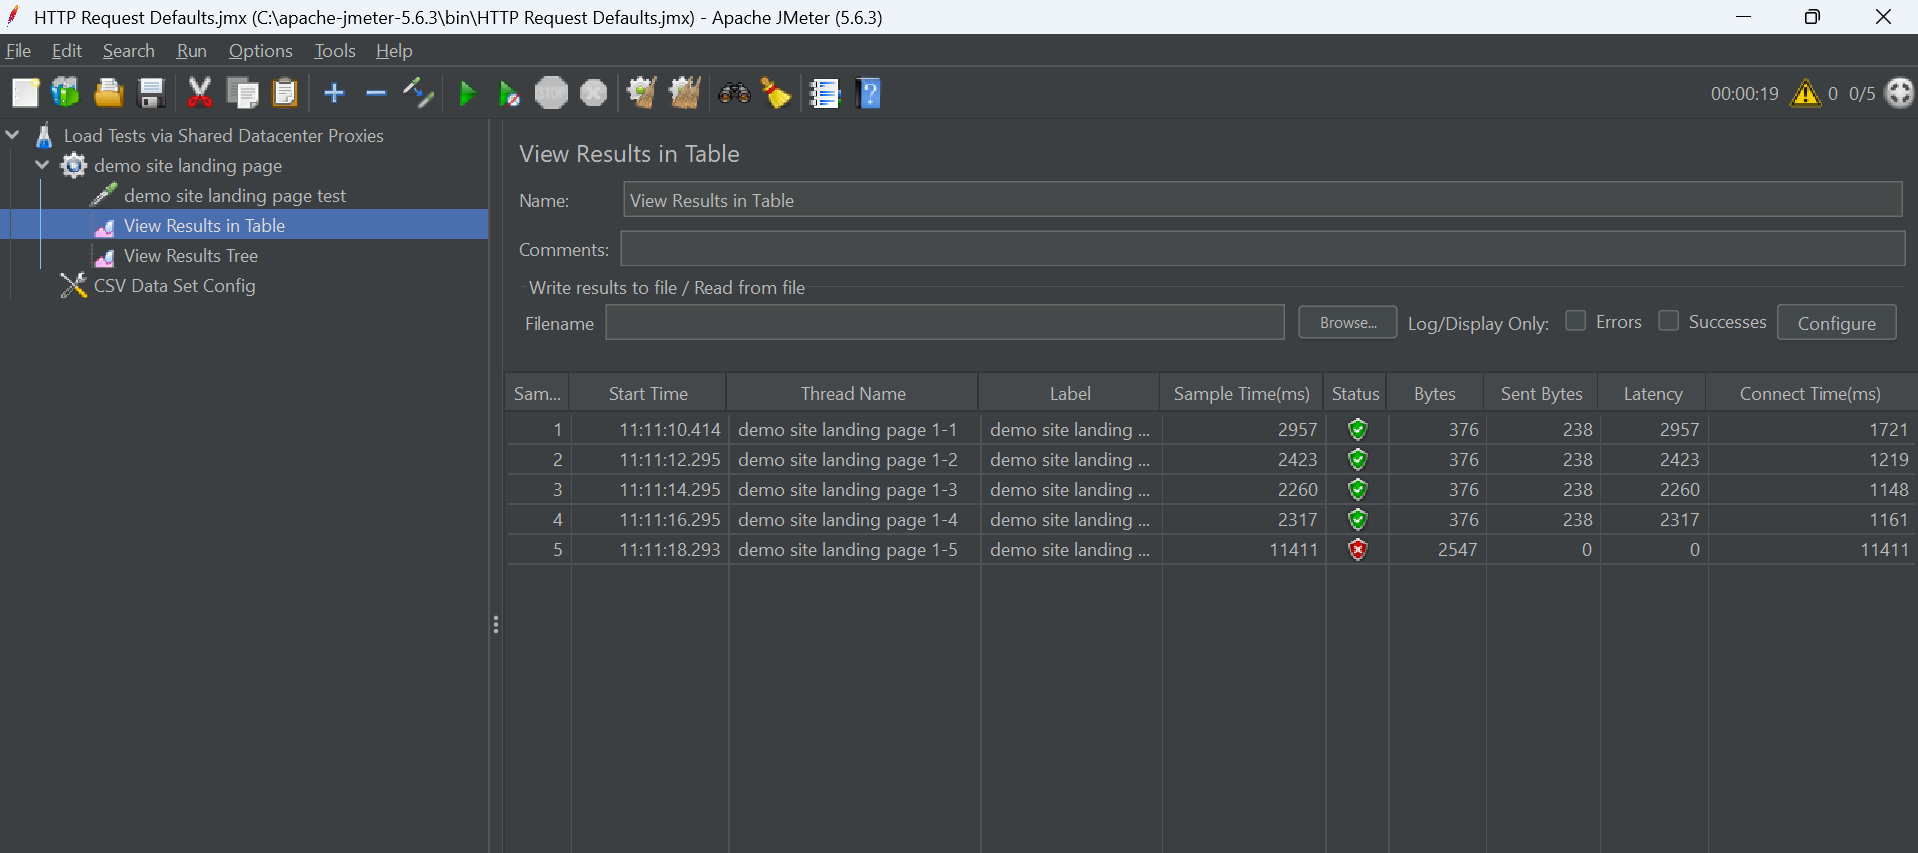
Choose Add > Listener > View Results in Tables: This displays all requests in a tabular view, listing metrics such as start time, elapsed time, response code, success/failure, and data size. It's helpful for quickly spotting slow or failing proxies and for comparing performance across multiple requests.
Using both listeners together lets you both debug individual proxy requests (Results Tree) and analyze overall performance trends (Results in Table).
Optional: Bulk Proxy Testing with CSV Input
To test multiple proxies automatically:
Create a CSV file named proxies.csv with the following format:
proxy,port,username,password
shp-testuser-us-v00001.tp-ns.com,8443,testuser,password
shp-testuser-us-v00002.tp-ns.com,8443,testuser,password
shp-testuser-us-v00003.tp-ns.com,8443,testuser,password
shp-testuser-us-v00004.tp-ns.com,8443,testuser,password
shp-testuser-us-v00005.tp-ns.com,8443,testuser,password
In JMeter:
Right-click Thread Group > Add > Config Element > CSV Data Set Config
Set Filename: proxies.csv
Variable Names: proxy,port,username,password
Delimiter: comma
Go back to your HTTP Request > Advanced tab > Proxy Server and set:
- Server:
${proxy} - Port:
${port} - Username:
${username} - Password:
${password}
JMeter will now use one proxy per thread automatically.
Expected Output from Demo Site:
If the proxy is working, the response from the demo site (demo-site.example.com) should confirm that the request was received. You can configure the demo site to return the requestor's IP address or location, which helps confirm whether the proxy was used.
Troubleshooting:
Problem: No response or timeout
Cause: Proxy offline or incorrect
Solution: Test another proxy or verify IP/port
Problem: 403 Forbidden
Cause: Target site blocked the proxy
Solution: Use a different proxy or test against a different site
Problem: Your local IP is returned
Cause: Proxy is not applied correctly
Solution: Recheck the Proxy Server settings under the Advanced tab
